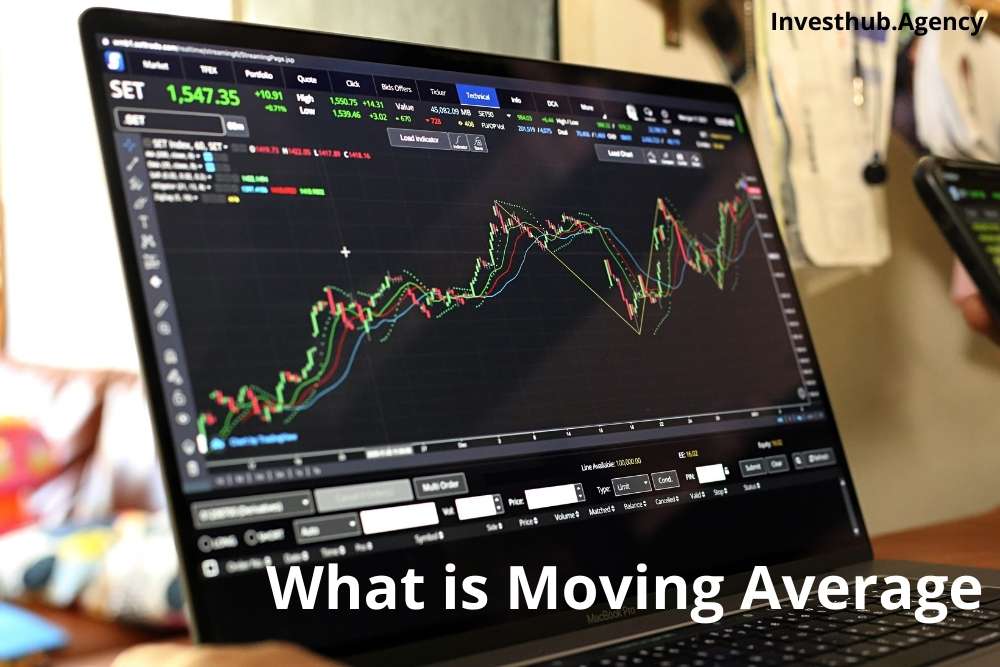
A moving average is a statistical computation used to examine data points by calculating the averages of different subsets of the entire data set. Moving averages work brilliantly as it is a stock market indicator extensively employed in technical analysis in finance. Determining a stock’s moving average is to smooth out price data by creating an average price that is constantly updated.
The effects of random, short-term variations on the price of a stock over a specific time frame are reduced by computing the MA. The purpose of generating a stock’s moving average is to smooth out price data over a set period of time by creating an average price that is constantly updated.
The larger the lag, the longer the MA’s time period. Because it includes values from the previous 200 days, a 200-day moving average will have a far greater lag than a 20-day MA. Investors pay close attention to the 50-day and 200-day MA for stocks, as they are crucial trading indications.
Moving averages Overview
A moving average is an indicator that creates a trend line by combining the price points of a trading instrument over a set time and dividing by the data points’ numbers. It is popular among investors since it can assist in determining the current trend’s direction while also reducing the influence of random price surges.
By analyzing the previous movement of an asset’s price, moving averages crossovers will allow you to access the level of support and resistance. It’s a change calculation that tracks a stock’s prior price action, analyzing financial markets’ moves in the past to predict future patterns.
A specific amount of data is required to calculate a MA, which might be a huge amount depending on the length of the moving average crossover system. For instance, a ten-day Moving Average will require ten days of data, but a one-year MA will require 365 days.
MA line is most typically employed over 200 days. Because the introduction of fresh figures will replace previous data points and move the line on the chart, the indicator is defined as ‘moving.’
How to use Moving Averages?
The moving average (MA) is a technical analysis tool that polishes price data by measuring updated moving average prices. The standard is calculated over a set length of time, such as ten days, 20 minutes, 30 weeks, or any other time period selected by the trader.
There are benefits to employing a moving average in your trading and many MA to choose from. MAs can be built in various methods and with varying days for the averaging interval.
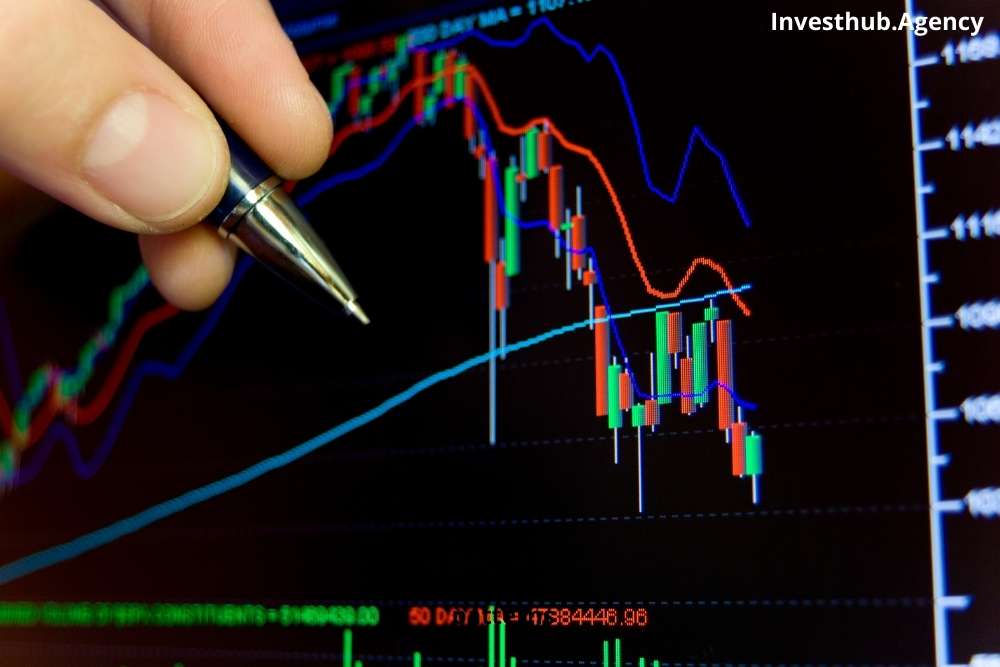
When asset prices cross over their MA, technical traders may receive a trading signal.
Of course, moving averages are valuable on their own, but they also serve as the foundation for other technical indicators like the MACD. For grabbing the complete knowledge of Trading Signals, you should visit the given link.
Moving Average Indicator
An average statistic measures how much a data series has changed over time. For example, technical analysts in finance frequently use moving averages to examine price patterns for individual securities.
An upward trend in moving averages could indicate a security’s price or momentum rise. Rise, On the other hand, a negative trend would be considered an indication of decline. Today, many moving averages range from simple measures to sophisticated formulas that require a computer program to calculate quickly.
Moving Averages used for what purpose?
Technical analysis, a form of investing that aims to understand and profit from the price movement patterns of securities and indices, makes extensive use of moving averages. Technical analysts commonly use multiple MAs to detect whether an asset is experiencing a shift in momentum, such as a sudden downward move in its price.
They may also use Multiple moving averages to substantiate their concerns about a shift. For example, if a company’s stock price movement rises over its 200-day moving average, it could be a positive indicator.
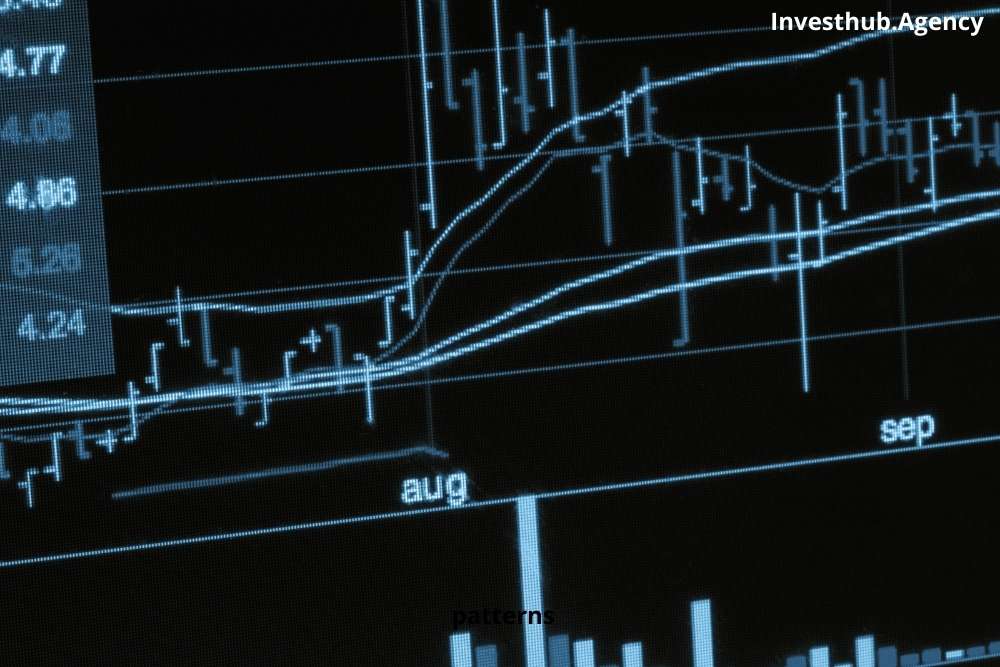
Types of Moving Average
The exponential moving average (EMA) and the simple moving average (SMA) are the two most popular MA types based on popularity alone. However, there are some distinctions between the EMA and SMA. Continue reading to understand more about the differences between SMA and EMA:
Simple Moving Average
Because of its simplicity of calculation, the simple moving average was well established before the development of internet-based trading. This is why the term “simple” moving average was coined. The SMA is the average of the closing prices for the specified time period.
The arithmetic mean of a set of data over a particular time period is used to calculate SMA. To put it another way, a group of numbers–or, in the case of financial instruments, prices–are added together and then divided by the number of prices in the group.
For instance, on a 20-day SMA, the MA represents the average asset price for that time period. The SMA compares current prices to a long-term standard by overlaying a chart with long-term price trends. As a result, longer-term SMAs are more slowly affected by significant price movements, whereas shorter-term SMA responds more quickly.
The simple moving average is determined using daily closing prices. Still, other time frames can be used even if they aren’t as prevalent additional pricing information, such as the median and opening prices, can also be used. That data is added to the calculation at the conclusion of the current price period, and the oldest price data in the series is removed.
SMAs are popular because they can easily depict long-term trends in securities over time. If the line is heading upward, the security is strengthening. However, if it is trending downward, the security is diminishing.
Exponential Moving Average
Even though the pace of decrease between the current price and its previous price is uneven, the EMA, based on the simple moving average, gives more weight to recent prices. For example, consider the following scenario: The EMA is the most “in the moment” of all moving averages because it concentrates on the most recent data points.
Because prices closer to the present day are given greater weight in the computation than past prices, EMAs are more difficult to calculate. One advantage of the (EMA) over the simple moving average is this: Rather than assigning equal weight to a price chart within a range, it focuses on recent past data. As a result, the previous period’s EMA reacts to price movements in a currency pair more quickly.
The EMA has the obvious advantage of having more recent data, which implies that the insights gleaned from this indicator are more likely to be useful to traders.
However, even though more recent data is given greater weight, Exponential moving averages are still lagging data, and some traders may be unwilling to use historical data to guide future trading decisions—especially when there are so many distinct factors that can affect currency values.
The EMA is more complicated than the SMA crossover, which is easier to understand for new traders. But on the other hand, traders who are focused on a long-term plan may be comfortable with the SMA’s even weight because they are looking at the big picture.
Simple Moving Average vs. Exponential Moving Average
You may believe that there are numerous differences between exponential moving averages and simple moving averages. However, this is not the case. The main distinction between them is how sensitive their calculations are to changes in data. The EMA gives current prices a lot of weight, but the SMA gives all values equal weight.
EMA and SMA are employed by technically focused traders to smooth out price volatility and are generally understood in the same way. However, due to the fact that the initial EMA rotates faster than the SMA, its efficiency is controlled by the time selected by the trader.
Many traders believe that the double EMA outperforms the simple moving average; however, the decision to employ one over the other is based on the application. Of course, it’s beneficial to know both of these indicators, but only time will tell if the EMA or SMA should play a large role in your trade assessment technique.
Some traders place a lot of weight on these indications, especially when combined with other indicators and chart patterns. Others may take a different approach and avoid the EMA and SMA entirely.
When and How to use Simple Moving Average?
Some may dispute the utility of SMAs in today’s world, but the truth is that they still work. Their adaptability is what makes them so powerful and current. Identifying reversals and trends, measuring the strength of an asset’s momentum, and determining possible places where an asset may find resistance or support are the greatest ways to use SMAs.
It’s vital to remember that, unlike the EMA, which gives more weight to recent prices, the SMA weighs each day’s price equally. This makes it a good tool for long-term trading because it smooths out recent volatility and gives you a bigger picture of price trends to help you predict trade possibilities further out.
Traders will also benefit from the flexibility to establish bespoke SMA time frames. As a result, they can use a variety of perspectives on a currency pair’s performance through time to forecast future price changes.
While traders can create their bespoke time frames based on their trading timeframes or objectives, many SMA users choose the 50-day or 200-day simple moving averages, which average out values over a rolling time frame.
SMAs aren’t the most elaborate or advanced technical indicator on the planet, but they can still be useful in a trading strategy.
When and How to use Exponential moving average?
Because EMAs are frequently utilized as a confirmatory measure, they rarely work independently. However, many traders use them in conjunction with other indicators to validate large financial market movements, confirming their credibility.
Because a previous period’s EMA value is often employed for short-term trading analysis, this indicator’s most common time periods are free 12-day and 26-day EMAs. However, in some circumstances where traders desire to calculate a previous period’s EMA value for long-term trade analysis, time frames most commonly associated with SMA charts—such as 50 days and even 200 days—may be used.
Because an EMA provides more weight to current price statistics, it is particularly useful for assessing short-term volatility and the trading opportunities that price movement may provide.
While you can extend an EMA to cover larger time frames, the most value comes from spreading the weighted average of more volatile stocks overran isolate this by using a simple moving average covering a 30-day, 50-day, or shorter time frame.
When to use SMA and EMA Together?
You might be able to utilize these averages together to evaluate a trade opportunity in some circumstances. An SMA, for example, could be used to assess the profit potential and momentum of a long-term position you’re considering. However, even if you’re looking to go long, EMA can help you time your trade by pinpointing the best trading window to enter ahead of price action.
If a trader is going long but wants to spend as little time as possible in a position, this technique may be preferable. You can use an EMA as the indicator that helps you trigger your trading activity, even though an SMA signals long-term growth.
There’s no escaping the fact that EMAs and SMAs are so widely used when it comes to indicators. Likewise, moving averages should be used by any forex trader, regardless of their degree of experience. Although neither is superior to the other, recognizing the differences is crucial—even if they aren’t opposed.
With that knowledge, it’s only a matter of figuring out which moving average is best for your trading style. So take this information—and don’t be scared to put it to use.
Conclusion
By smoothing out price data and generating a single flowing line. This makes it simplest to spot the pattern. In addition, simple moving averages react to price fluctuations more slowly than EMA.
This may be beneficial in some circumstances, but it may also result in erroneous signals in others. For example, moving averages with a shorter look-back period (20 days, for example) will react to price movements more quickly than those with a longer look-back period of 200 days.
For both entrances and exits, moving average crossovers are a common approach. Traders can use MAs to identify potential regions of support or resistance with the help of scam-free trading platforms like ABInvesting. While this may appear to be predictive, moving averages are always based on previous data and display the average price over a given period of time.
FAQs
Q1. How to calculate Moving Average?
The moving average is determined by multiplying the sum of a stock’s values by the total number of periods during a given time.
Q2. Which type of Moving Average is Best?
The 21-period MA is the most accurate and medium-term MA. When it comes to following trends, this is a plus.
The 50 period MA is a long-term moving average useful for determining long-term trends.
Q3. Why are Moving Averages so important for trading?
Moving averages aid in determining where a trend begins and ends. The direction of the stock’s moving average is significant since it indicates the direction of the trend. The price has moved below the MA when the MA starts to indicate down.
Q4. Which MA is better, SMAs or EMAs?
EMAs give recent data a higher weighting than older data. They are more responsive to recent price changes than SMAs, making EMA returns more timely and explaining why the EMA is the preferred average among many traders.
